
提示
Arthas 是Alibaba开源的Java诊断工具,深受开发者喜爱。
1、现有的问题
我们日常开发中,代码中遇到问题可以使用DEBUG调试
追踪方法执行过程,查看参数及返回报错信息等,定位和解决问题
- 在服务器上[日常环境,联调,预发及线上,没有IDE环境]遇到问题,如何定位?
看日志?
如果是数据问题呢?
- 某个接口执行过慢,如何定位是哪个服务?哪个方法?那行代码的问题,整个请求链中哪个步骤慢?
StopWatch?
每个方法中都是用AOP?
- 代码明明修改了,运行的结果还是旧的,代码修复后似乎没有生效?
查看线上仓库代码?
代码确实是对的,但是执行的似乎是就的代码?
- 线上有个紧急问题,但是又不能或没有权限立即上线更新?客户较大,如果立即处理?
Python,Php等脚本语言可以直接修改线上代码
Java如何做到热更新?
2、Arthas能做什么
| 问题 | 如何处理 |
|---|---|
| 追踪方法执行过程,查看参数及返回报错信息 | watch |
| 某个接口执行过慢,如何定位是哪个服务?哪个方法 | trace |
| 代码明明修改了,运行的结果还是旧的 | jad |
| 热更新 | jad/mc/redefine |
3、Arthas介绍
当你遇到以下类似问题而束手无策时,Arthas可以帮助你解决:
- 这个类从哪个 jar 包加载的?为什么会报各种类相关的 Exception?
- 我改的代码为什么没有执行到?难道是我没 commit?分支搞错了?
- 遇到问题无法在线上 debug,难道只能通过加日志再重新发布吗?
- 线上遇到某个用户的数据处理有问题,但线上同样无法 debug,线下无法重现!
- 是否有一个全局视角来查看系统的运行状况?
- 有什么办法可以监控到JVM的实时运行状态?
- 怎么快速定位应用的热点,生成火焰图?
- 怎样直接从JVM内查找某个类的实例?
Arthas支持JDK 6+,支持Linux/Mac/Windows,采用命令行交互模式,同时提供丰富的 Tab 自动补全功能,进一步方便进行问题的定位和诊断。
4、Arthas安装
下载arthas-boot.jar,然后用java -jar的方式启动:
下载地址: https://arthas.aliyun.com/arthas-boot.jar
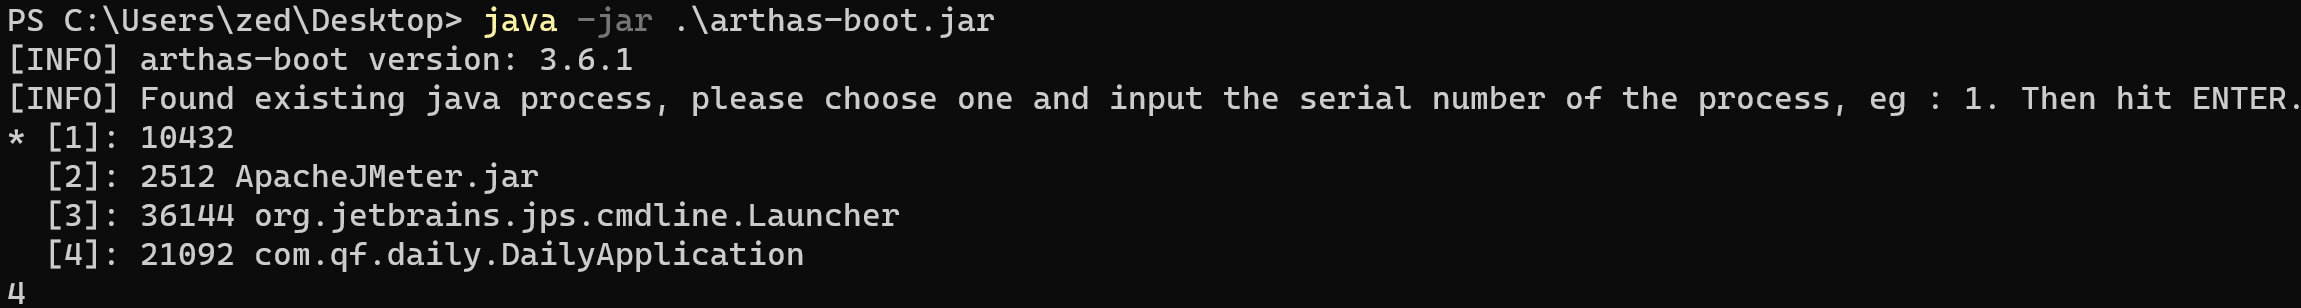
启动完成后,arthas会检测系统中的java进程,需要手动输入应用名称对用的编号:
比如输入: 4 回车
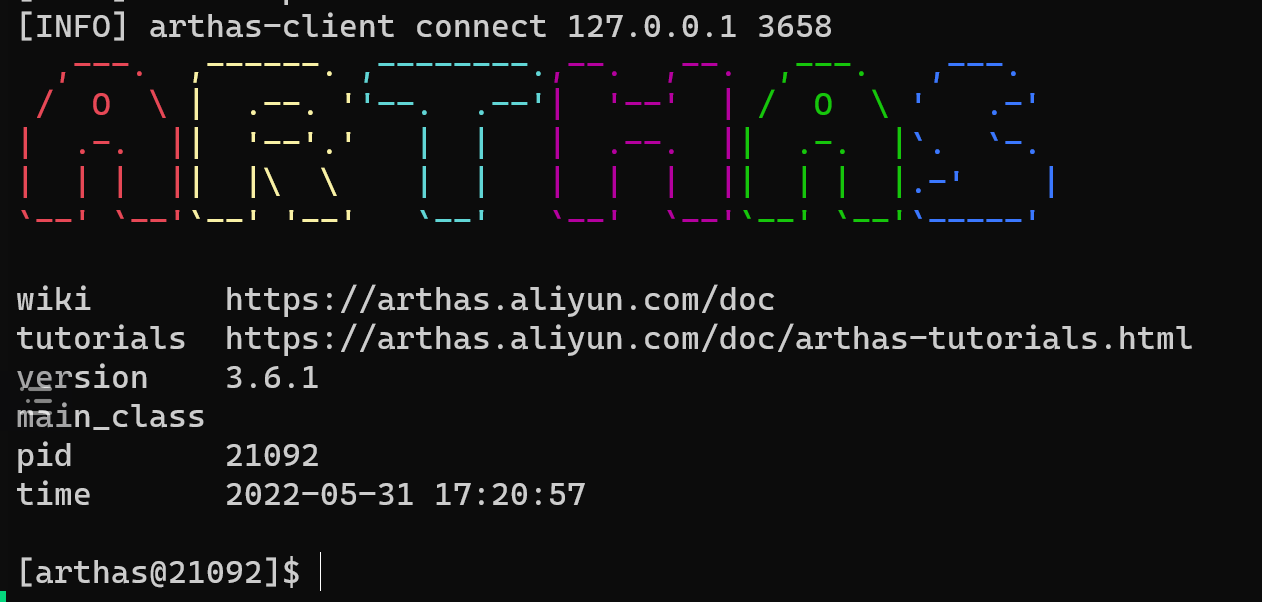
看到下面的界面说明启动成功,已经进入arthas的命令模式,就可以使用命令操作arthas
5、Arthas常用命令
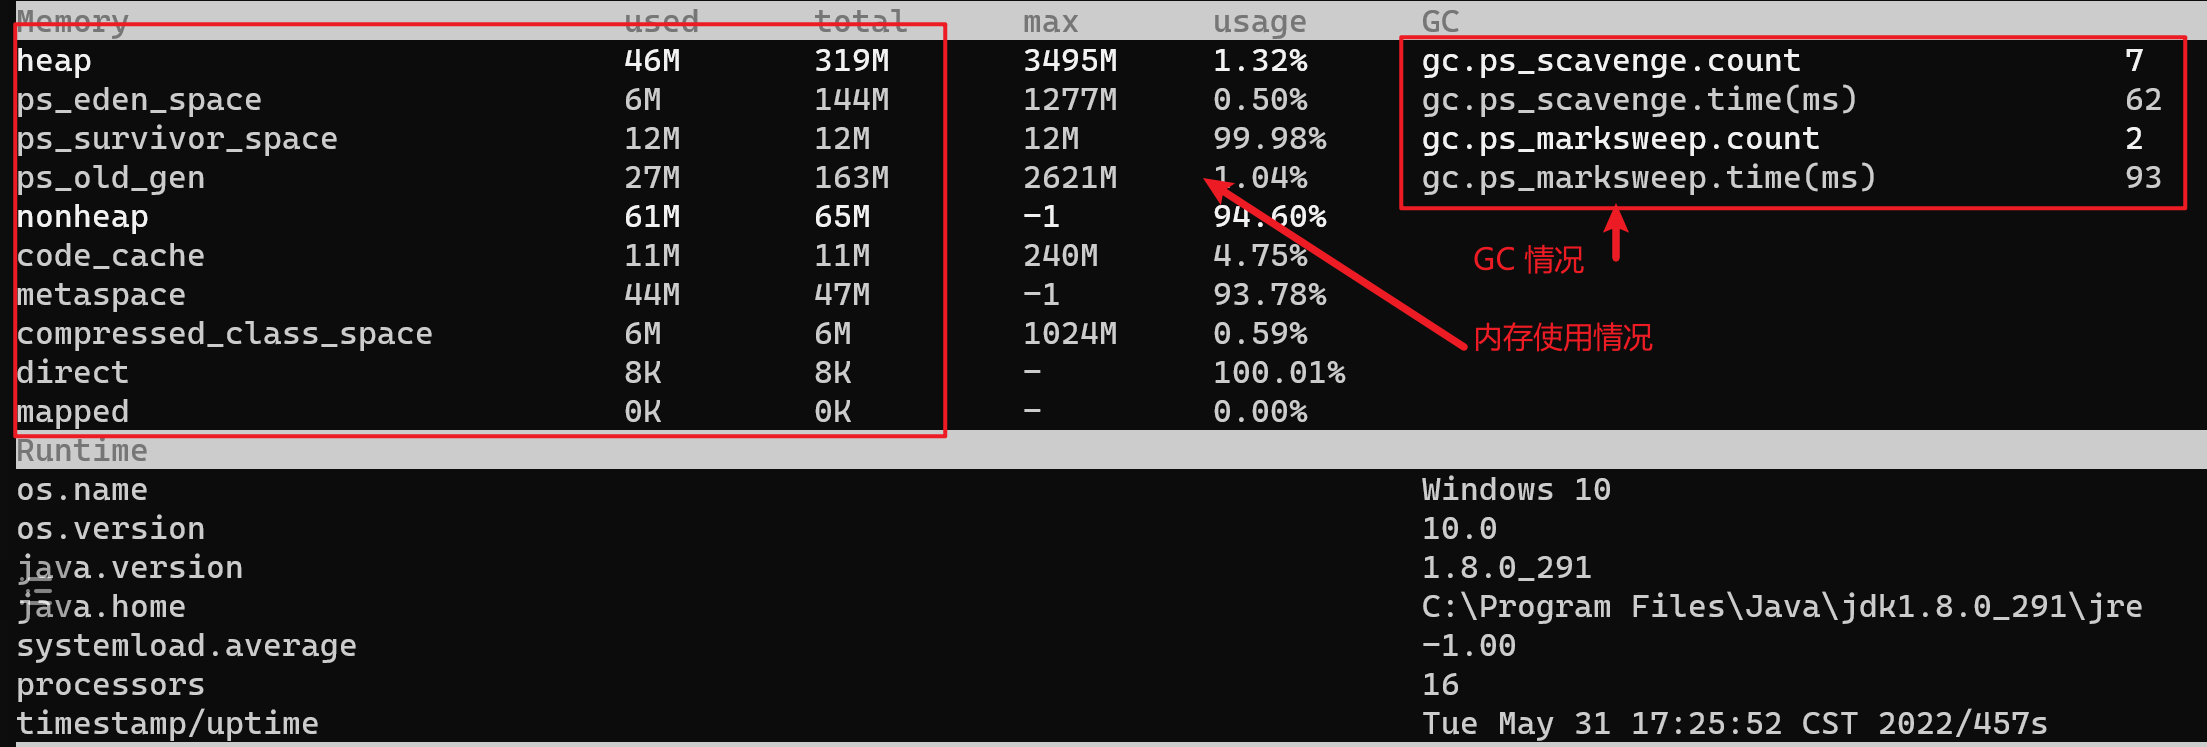
dashboard命令
输入dashboard,按回车/enter,会展示当前进程的信息,按ctrl+c可以中断执行。
sh
ID    NAME                                 GROUP             PRIORITY     STATE       %CPU        DELTA_TIME  TIME         INTERRUPTED DAEMON
38    File Watcher                         main              5            TIMED_WAITI 1.25        0.062       0:3.156      false       true
74    Timer-for-arthas-dashboard-94d722e6- system            5            RUNNABLE    0.63        0.031       0:0.125      false       true
-1    C1 CompilerThread9                   -                 -1           -           0.31        0.015       0:0.296      false       true
-1    C1 CompilerThread8                   -                 -1           -           0.31        0.015       0:0.375      false       true
-1    C1 CompilerThread10                  -                 -1           -           0.31        0.015       0:0.343      false       true
2     Reference Handler                    system            10           WAITING     0.0         0.000       0:0.000      false       true
3     Finalizer                            system            8            WAITING     0.0         0.000       0:0.015      false       true
4     Signal Dispatcher                    system            9            RUNNABLE    0.0         0.000       0:0.000      false       true
5     Attach Listener                      system            5            RUNNABLE    0.0         0.000       0:0.031      false       true
21    RMI TCP Accept-0                     system            5            RUNNABLE    0.0         0.000       0:0.562      false       true
29    RMI Scheduler(0)                     system            5            TIMED_WAITI 0.0         0.000       0:0.000      false       true
61    arthas-timer                         system            5            WAITING     0.0         0.000       0:0.000      false       true
64    arthas-NettyHttpTelnetBootstrap-3-1  system            5            RUNNABLE    0.0         0.000       0:0.031      false       true
65    arthas-NettyWebsocketTtyBootstrap-4- system            5            RUNNABLE    0.0         0.000       0:0.000      false       true
66    arthas-NettyWebsocketTtyBootstrap-4- system            5            RUNNABLE    0.0         0.000       0:0.000      false       true
67    arthas-shell-server                  system            5            TIMED_WAITI 0.0         0.000       0:0.000      false       true
68    arthas-session-manager               system            5            TIMED_WAITI 0.0         0.000       0:0.000      false       true
69    arthas-UserStat                      system            5            WAITING     0.0         0.000       0:0.000      false       true
71    arthas-NettyHttpTelnetBootstrap-3-2  system            5            RUNNABLE    0.0         0.000       0:0.125      false       true
73    arthas-command-execute               system            5            TIMED_WAITI 0.0         0.000       0:0.000      false       true
Memory                          used      total      max       usage      GC
heap                            156M      320M       3495M     4.49%      gc.ps_scavenge.count                 6
ps_eden_space                   142M      144M       1285M     11.11%     gc.ps_scavenge.time(ms)              47
ps_survivor_space               0K        13312K     13312K    0.00%      gc.ps_marksweep.count                2
ps_old_gen                      14M       163M       2621M     0.54%      gc.ps_marksweep.time(ms)             93
nonheap                         61M       65M        -1        94.61%
code_cache                      11M       11M        240M      4.73%
metaspace                       44M       47M        -1        93.77%
compressed_class_space          6M        6M         1024M     0.59%
direct                          8K        8K         -         100.01%
mapped                          0K        0K         -         0.00%
Runtime
os.name                                                                   Windows 10
os.version                                                                10.0
java.version                                                              1.8.0_291
java.home                                                                 C:\Program Files\Java\jdk1.8.0_291\jre
systemload.average                                                        -1.00
processors                                                                16
timestamp/uptime Tue May 31 17:25:27 CST 2022/432sjad命令
使用jad 后面跟上类的全限定名,反编译指定的类
jad com.glls.daily.controller.DailyController
java
[arthas@21092]$ jad com.glls.daily.controller.DailyController

ClassLoader:
+-org.springframework.boot.devtools.restart.classloader.RestartClassLoader@2c6b4da9
  +-sun.misc.Launcher$AppClassLoader@18b4aac2
    +-sun.misc.Launcher$ExtClassLoader@27082746

Location:
/C:/Users/zed/Desktop/daily/target/classes/

       package com.glls.daily.controller;

       import com.github.pagehelper.PageInfo;
       import com.glls.daily.domain.Daily;
       import com.glls.daily.response.Response;
       import com.glls.daily.service.DailyService;
       import java.util.Date;
       import org.springframework.web.bind.annotation.GetMapping;
       import org.springframework.web.bind.annotation.PathVariable;
       import org.springframework.web.bind.annotation.PostMapping;
       import org.springframework.web.bind.annotation.RequestBody;
       import org.springframework.web.bind.annotation.RequestMapping;
       import org.springframework.web.bind.annotation.RestController;

       @RestController
       @RequestMapping(value={"daily"})
       public class DailyController {
           private final DailyService dailyService;

           public DailyController(DailyService dailyService) {
               this.dailyService = dailyService;
           }
       @21092]$
           @GetMapping(value={"view/{id}"})
           public Response<Daily> viewDailyById(@PathVariable(value="id") Integer id) {
/*40*/         return Response.success((Object)this.dailyService.selectById(id));
           }

       }

Affect(row-cnt:1) cost in 774 ms.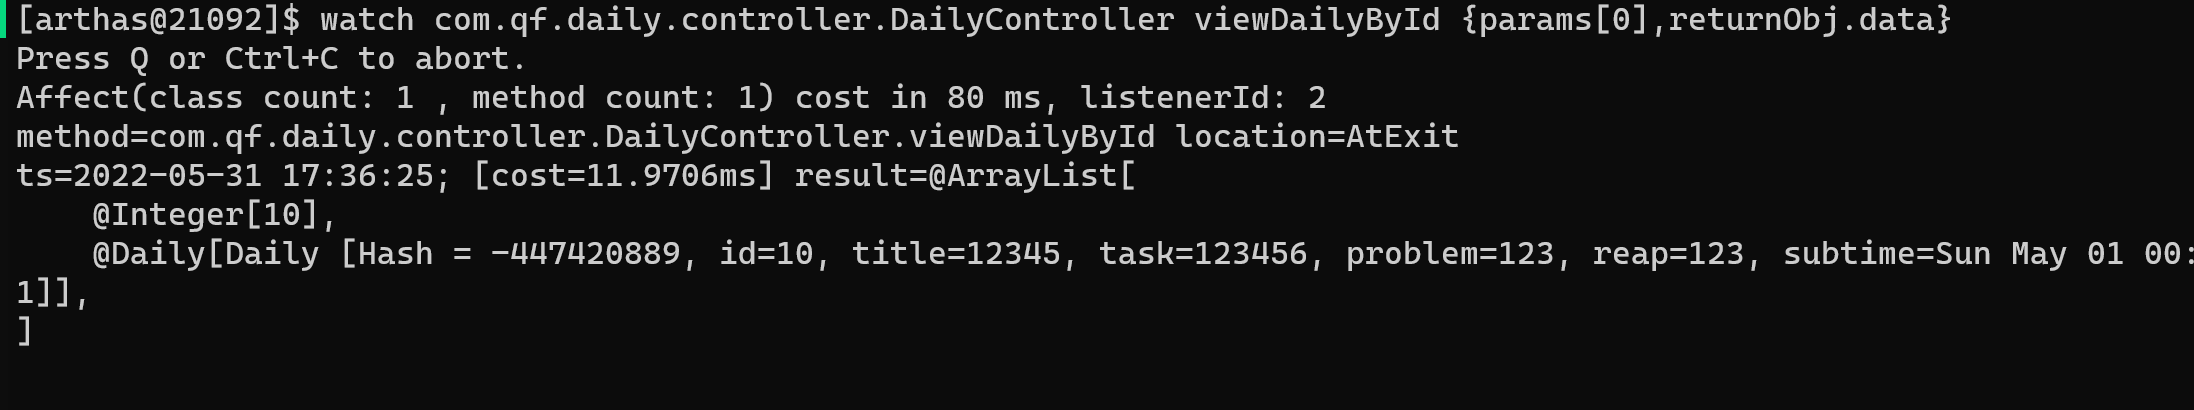
[arthas@21092]$watch命令[重点]
通过watch命令来查看函数的返回值,参数,异常信息
java
watch com.glls.daily.controller.DailyController viewDailyById {params[0],returnObj.data}watch 完整的类名 方法名 {params表示参数,returnObj表示返回值,throwExp:表示抛出的异常}
trace命令[重点]
跟踪方法内部调用路径,并输出方法路径上的每个节点上耗时
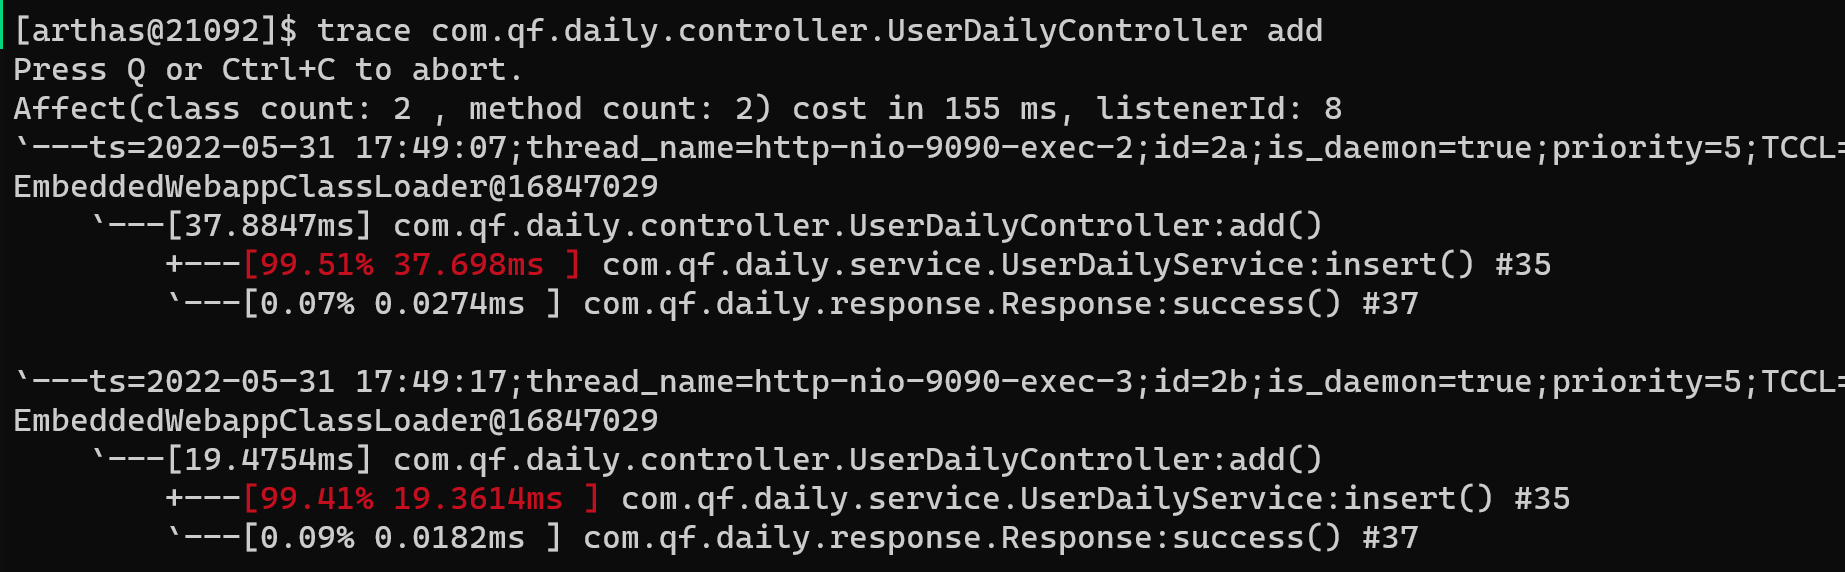
sh
trace com.glls.daily.controller.UserDailyController addtrace 类的完整限定名 方法名
作用:跟踪方法调用链上的耗时
退出Arthas
shell
[arthas@21092]$ exit
PS C:\Users\zed\Desktop> # 退出了Arthas